Video or image
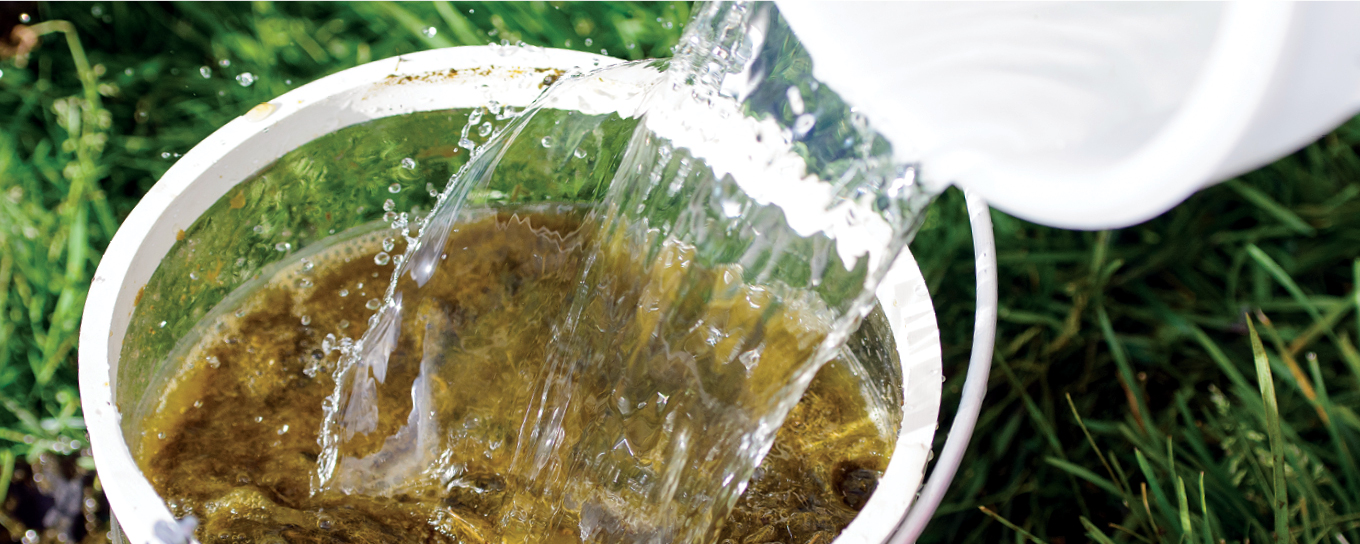
Effluent testing and use: knowing what is in your pond
Having the ability to utilise dairy effluent as a source of nutrients for pasture growth effectively utilises on-farm resources.
Dairy farm effluent is mainly comprised of dung, urine, udder wash water, milking plant wash water and milk spillages. It contains valuable nutrients (nitrogen, phosphorus, potassium and sulphur) and adds organic matter to your soil profile. When using effluent as a nutrient source on-farm, the nitrogen availability to plants is generally less in comparison to granular fertiliser applications, due to the nutrients being bound up in your soil’s organic matter.
The crude protein of a feed is the nitrogen percentage multiplied by 6.25. When using this equation, it shows that the crude protein content of the diet can result in significantvariation of the nitrogen analysis within the effluent. Nitrogen put into the animal that doesn’t come out in milk protein potentially ends up in your effluent as dung or urine. When working in a dairy system, the basic minimum crude protein number required by a dairy cow is 18 percent. Quite often during the spring and autumn this can reach as high as 25 to 30 percent crude protein in a ryegrass/white clover sward. As a result, the nitrogen content in the effluent system may be higher, as crude protein supply of the diet exceeds the animal’s demand.
As your pasture moves into its reproductive phase (seed head) over the summer months, the crude protein generally decreases. However, the pasture crude protein may be higher if you have irrigated pastures. Taking samples of your effluent in spring and again in summer (due to the variance in your dairy cows’ diet), will give you a more accurate assessment of the nutrient composition of the effluent being applied.
How do you sample?
Hill Laboratories carries out dairy effluent tests. The comprehensive analysis allows you better proof of placement around annual loading rates, as well as effective plant demand vs supply application rates. Wherever possible, synchronising effluent applications with your herd and paddock rotations allows for sufficient time between grazing and nutrient uptake. Nutrient concentrations in your effluent results are reported as milligrams per litre (mg per L), where mg per L is the same as kilograms in one million litres. This is useful to comprehend as we apply fertiliser in kg per ha and effluent ponds are often measured in mega litres (ML).
Nitrogen availability varies between liquid and solid effluent. Liquid effluent often has a high proportion of nitrogen that is plant-available. On the other hand, effluent sludge is predominately in the organic slow release form. The sludge needs to be mineralised in order for the nutrients to be converted into plant available forms.
For more advice or to complete an effluent test, ask your local PGG Wrightson Technical Field Representative.
Related News
Video or image
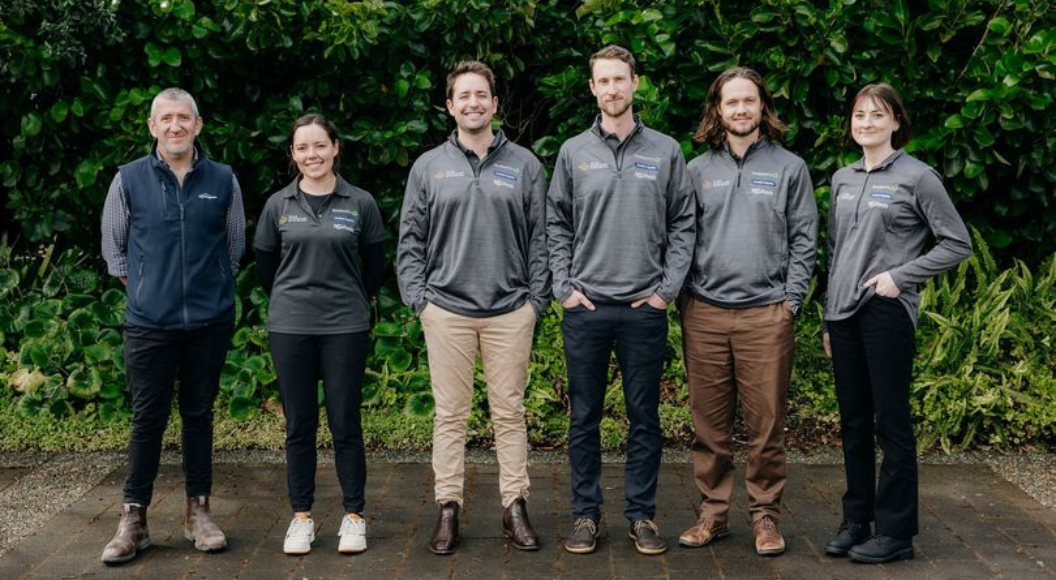
Final Five in the Young Horticulturist of the Year 2024 Competition
The stakes are high for the five finalists in the Young Horticulturist of the Year awards, who met last week for an orientation day in the lead-up to the finals. The competition aims to encourage young people in horticulture to develop their skills and knowledge further and build connections with...
Video or image
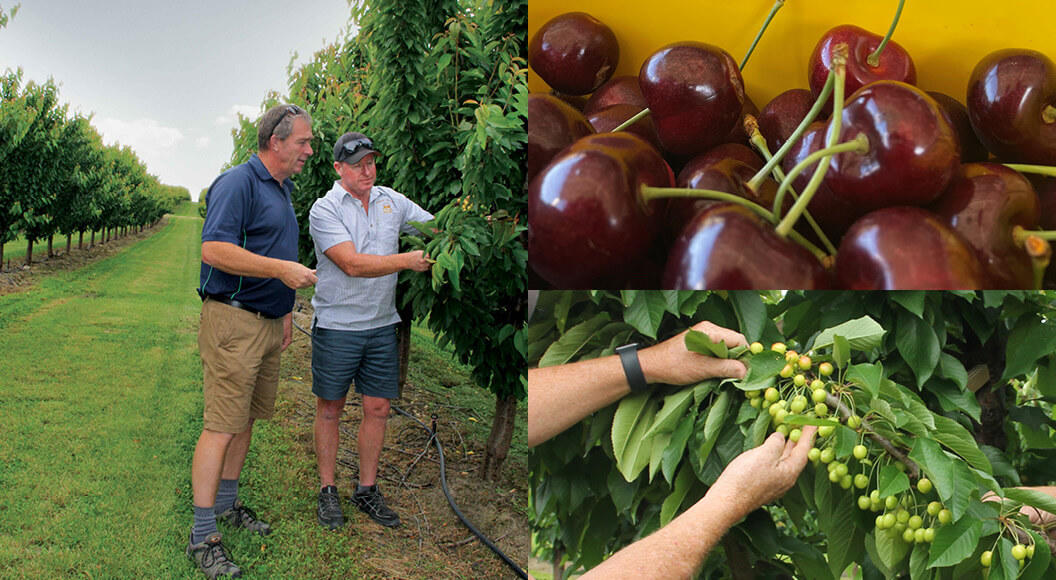
3 Kings Cherries Reigns Supreme
Pictured: Fruitfed Supplies Technical Horticultural Representative, Blair Deaker, assesses potential fruit drop in the cherries with Tim Paulin, Managing Director of 3 Kings Cherries near Dunstan, Central Otago. The 'Three Kings' rock formations sit on the mountains above the Clutha River and...
Video or image
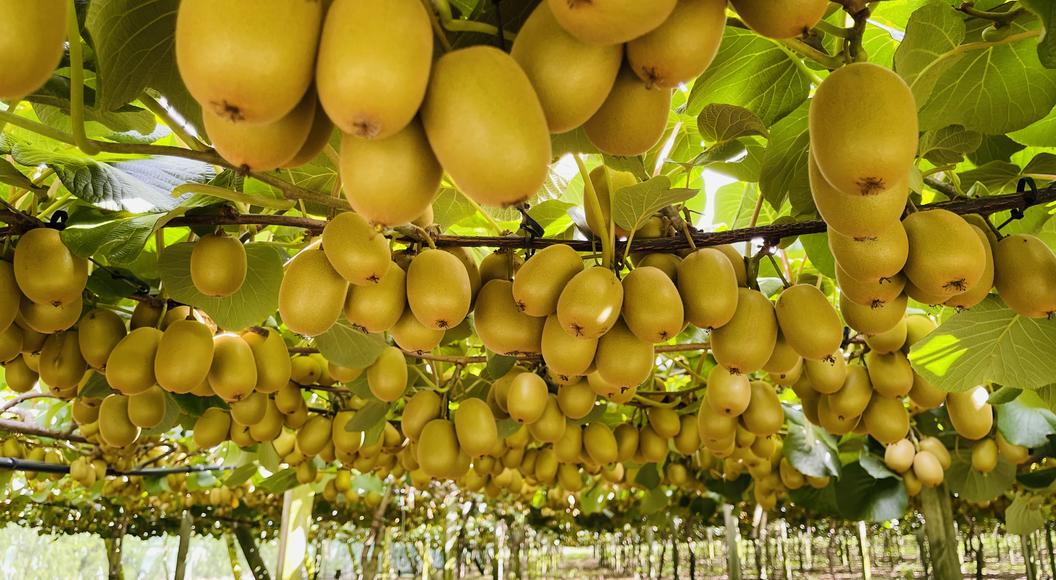
Premium Bay of Plenty kiwifruit listings could exceed $100 million
Several desirable Bay of Plenty kiwifruit properties have listed for sale recently and are set to change hands for a combined value that could exceed $100 million. Stan Robb and Dave McLaren of PGG Wrightson Real Estate, Te Puke have listed 10 orchards between them this month. Comprising some 67...
Video or image
Final Five in the Young Horticulturist of the Year 2024 Competition
The stakes are high for the five finalists in the Young Horticulturist of the Year awards, who met last week for an orientation day in the lead-up to the finals. The competition aims to encourage young people in horticulture to develop their skills and knowledge further and build connections with...
Video or image
3 Kings Cherries Reigns Supreme
Pictured: Fruitfed Supplies Technical Horticultural Representative, Blair Deaker, assesses potential fruit drop in the cherries with Tim Paulin, Managing Director of 3 Kings Cherries near Dunstan, Central Otago. The 'Three Kings' rock formations sit on the mountains above the Clutha River and...
Video or image
Premium Bay of Plenty kiwifruit listings could exceed $100 million
Several desirable Bay of Plenty kiwifruit properties have listed for sale recently and are set to change hands for a combined value that could exceed $100 million. Stan Robb and Dave McLaren of PGG Wrightson Real Estate, Te Puke have listed 10 orchards between them this month. Comprising some 67...